
Following the fifth part of the OPC Router tutorial, I’m presenting how to build a process data simulator using a very basic Python application and the “CSV” object. Remember, we’re configuring and running a project for “Papín”, a fictional potato bread factory.
Why an OPC Router tutorial with a Simulator?
Because “learning by doing” with examples is fun. Also, this particular functionality can bring us an excellent use case: the ability to reproduce the behavior of a process by simulating real data, which it’s a great choice when we want to create or test algorithms that improve the performance of a plant. See below a list of posts that complete this tutorial:
- Getting Started with OPC Router
- Connect an OPC DA server to Microsoft SQL Server
- Connect an MQTT data source to InfluxDB Cloud
- Perform multiple calculations within OPC Router
- Run an OPC Router application with Linux and Docker
- Build a process data simulator with Python, CSV and OPC Router (this post)
- Explore basic RESTful web services within OPC Router
- Build a Telegram basic interaction within OPC Router
- Build an SMS basic interaction within OPC Router
- Build a WhatsApp basic interaction within OPC Router
- Build a Teams basic interaction within OPC Router
- Explore advanced RESTful web services within OPC Router
- Run an OPC Router application with Portainer
Prerequisites
Firstly, you’ll need:
- Microsoft Excel software 🧮
- Master dataset file from your real process data 📚
- Microsoft SQL Server database 🧱
- Power BI visualization tool 📈
- Python v3.8.9 or later 🐍
- Python packages “pandas”, “xlrd” and “openpyxl” 📦
- Schematic diagram 📝
- OPC Router Config application 💻
Schematic Diagram
To illustrate this idea better, look at this:
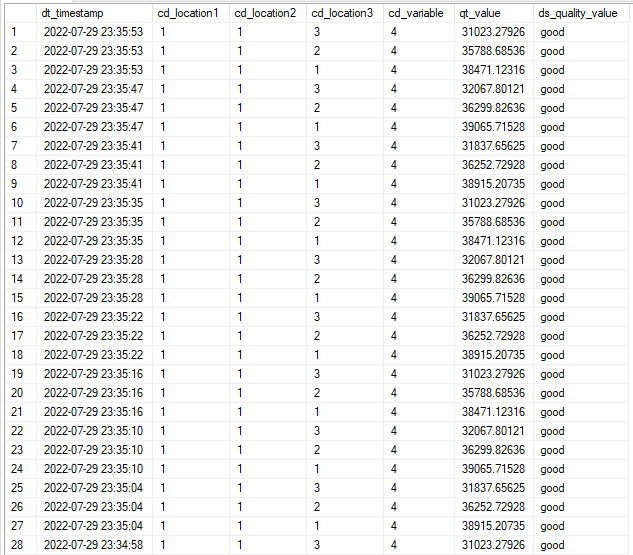
At this instant, the requirement ask us to simulate time-series data from seven (7) process variables: MCurr (VSD motor current), MFreq (VSD motor frequency), MTorq (VSD motor torque), MPow (VSD motor power), MVolt (VSD motor voltage), MSpd (VSD motor speed) and AirP (line air pressure). Each variable must comply with the following data structure:
Following this, let’s see some sample time-series data from MPow:
Describing your Components
- Initially, let’s start with the description of every component of our application:
Master dataset
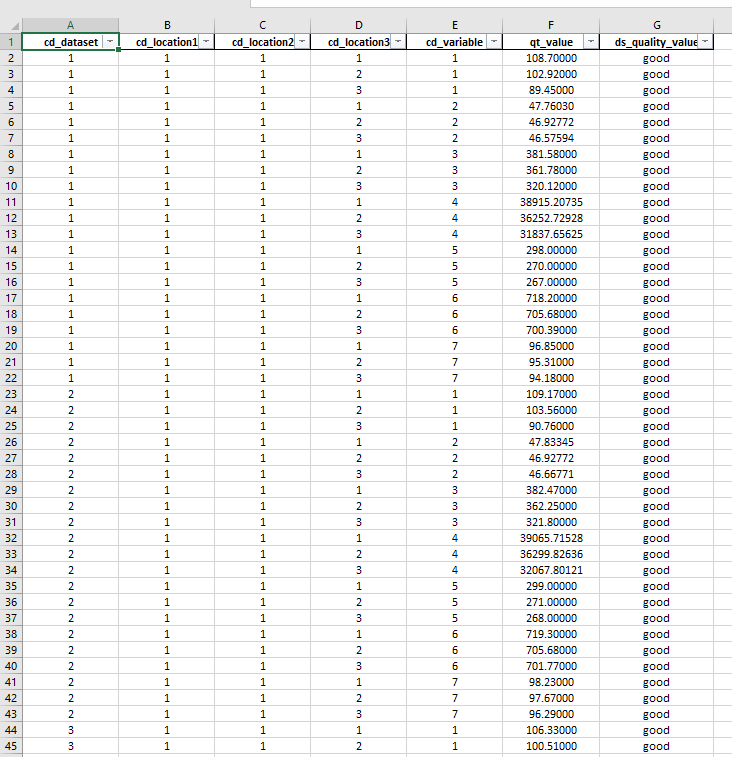
This is our main resource. We put here the real data we want to simulate. Every value of “cd_dataset” gives us a block of data by time. The data structure use fields “cd_dataset”, “cd_location1”, “cd_location2”, “cd_location3”, “cd_variable”, “qt_value” and “ds_quality_value”. Let’s see a sample of that file:
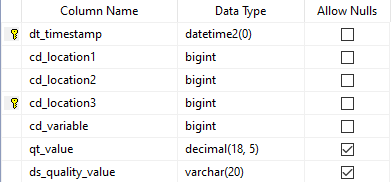
SQL Server tables
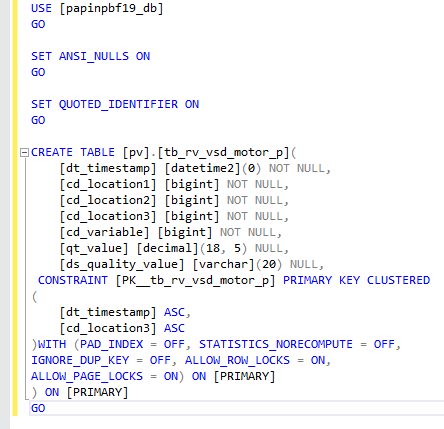
This is the place where we store the simulated data, a table per variable. Use this SQL script to create the tables (if you haven’t created yet):
USE [papinpbf19_db]
GO

SET ANSI_NULLS ON
GO

SET QUOTED_IDENTIFIER ON
GO

CREATE TABLE [pv].[tb_rv_vsd_motor_p](
	[dt_timestamp] [datetime2](0) NOT NULL,
	[cd_location1] [bigint] NOT NULL,
	[cd_location2] [bigint] NOT NULL,
	[cd_location3] [bigint] NOT NULL,
	[cd_variable] [bigint] NOT NULL,
	[qt_value] [decimal](18, 5) NULL,
	[ds_quality_value] [varchar](20) NULL,
 CONSTRAINT [PK__tb_rv_vsd_motor_p] PRIMARY KEY CLUSTERED
(
	[dt_timestamp] ASC,
	[cd_location3] ASC
)WITH (PAD_INDEX = OFF, STATISTICS_NORECOMPUTE = OFF,
IGNORE_DUP_KEY = OFF, ALLOW_ROW_LOCKS = ON,
ALLOW_PAGE_LOCKS = ON) ON [PRIMARY]
) ON [PRIMARY]
GO
This is how the script looks in SQL Server Management Studio when creating a table for MPow:
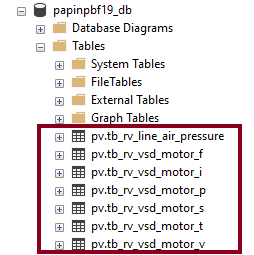
- After that, watch the seven (7) SQL Server tables:
SQL Server view
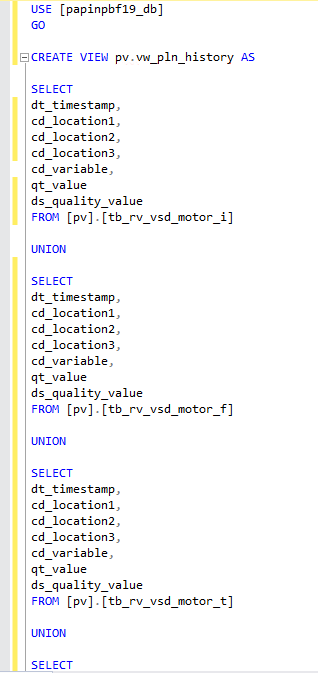
A SQL Server view will be necessary to visualize all variables in Power BI. Use this script to create it:
USE [papinpbf19_db]
GO

CREATE VIEW pv.vw_pln_history AS

SELECT
dt_timestamp,
cd_location1,
cd_location2,
cd_location3,
cd_variable,
qt_value,
ds_quality_value
FROM [pv].[tb_rv_vsd_motor_i]

UNION

SELECT
dt_timestamp,
cd_location1,
cd_location2,
cd_location3,
cd_variable,
qt_value,
ds_quality_value
FROM [pv].[tb_rv_vsd_motor_f]

UNION

SELECT
dt_timestamp,
cd_location1,
cd_location2,
cd_location3,
cd_variable,
qt_value,
ds_quality_value
FROM [pv].[tb_rv_vsd_motor_t]

UNION

SELECT
dt_timestamp,
cd_location1,
cd_location2,
cd_location3,
cd_variable,
qt_value,
ds_quality_value
FROM [pv].[tb_rv_vsd_motor_p]

UNION

SELECT
dt_timestamp,
cd_location1,
cd_location2,
cd_location3,
cd_variable,
qt_value,
ds_quality_value
FROM [pv].[tb_rv_vsd_motor_v]

UNION

SELECT
dt_timestamp,
cd_location1,
cd_location2,
cd_location3,
cd_variable,
qt_value,
ds_quality_value
FROM [pv].[tb_rv_vsd_motor_s]

UNION

SELECT
dt_timestamp,
cd_location1,
cd_location2,
cd_location3,
cd_variable,
qt_value,
ds_quality_value
FROM [pv].[tb_rv_line_air_pressure]

--ORDER BY
--dt_timestamp,
--cd_location1,
--cd_location2,
--cd_location3,
--cd_variable,
--qt_value,
--ds_quality_value DESC
This is how the script looks in SQL Server Management Studio:
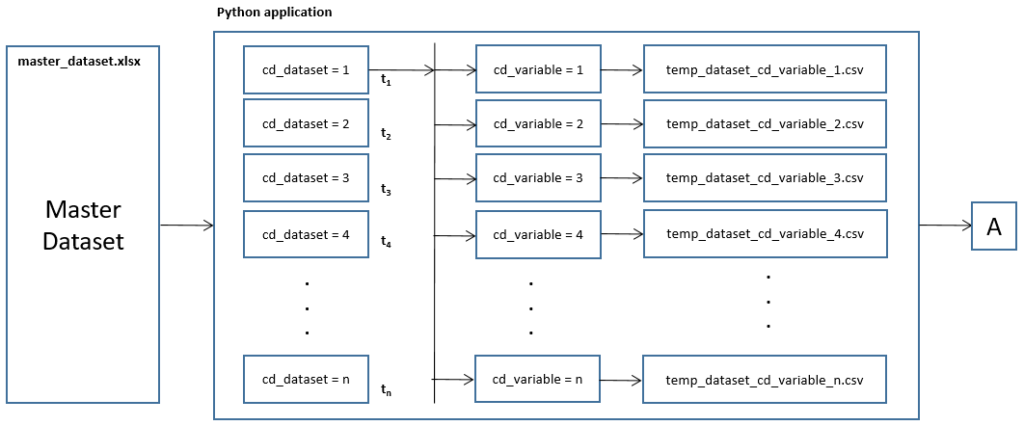
Python application
A Python application has a critical role in the data injection, with a few clear goals in mind:
- Read the master dataset Excel file.
- Ask the user for the desired data update rate.
- Ask the user where to begin and where to finish in the dataset.
- Extract data blocks filtered by “cd_dataset”.
- Extract data blocks filtered by “cd_variable”.
- Create the structured CSV files, with a timestamp included.
- Repeat the selected data sequence indefinitely.
#!/usr/bin/env python3
# Papín® process data simulator from master dataset file
import pandas as pd
import time
master_filename = "master_dataset.xlsx"
index_variable = 1
def main():
print('------------------------------------------------------')
print(' Papín® Process Data Simulator from Master Dataset File ')
print('------------------------------------------------------')
print()
print(' Set actions (press [Ctrl+C] to leave): ')
update_rate = int(input(" 1. Please set update rate (in seconds): "))
start_index = int(input(" 2. Please set start index (starts at 1): "))
end_index = int(input(" 3. Please set end index: "))
df1 = pd.read_excel(master_filename, dtype={'qt_value': float})
unique_rows = df1.cd_dataset.size
data_blocks = df1.cd_dataset.nunique()
number_variables = df1.cd_variable.nunique()
print()
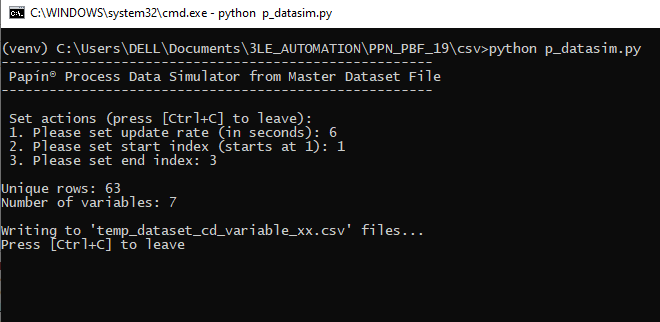
print(f"Unique rows: {unique_rows}")
print(f"Number of variables: {number_variables}")
print()
print("Writing to 'temp_dataset_cd_variable_xx.csv' files... ")
print("Press [Ctrl+C] to leave\n\n")
while True:
try:
si = start_index
ei = end_index
nv = number_variables
iv = index_variable
while si <= ei:
df2 = df1.query("cd_dataset == @si")
for iv in range(index_variable, nv + 1):
df3 = df2.query("cd_variable == @iv")
df4 = df3.rename(columns={'cd_dataset': 'dt_timestamp'})
df4.dt_timestamp = df4.dt_timestamp.astype('datetime64[ns]')
t = time.time()
df4.dt_timestamp = time.strftime(
"%Y-%m-%dT%H:%M:%S",
time.localtime(t))
df4.to_csv(
f"temp_dataset_cd_variable_{iv}.csv",
index=None,
header=True)
si += 1
time.sleep(update_rate)
except KeyboardInterrupt:
print("\n\nLeaving.")
raise SystemExit(1)
if __name__ == '__main__':
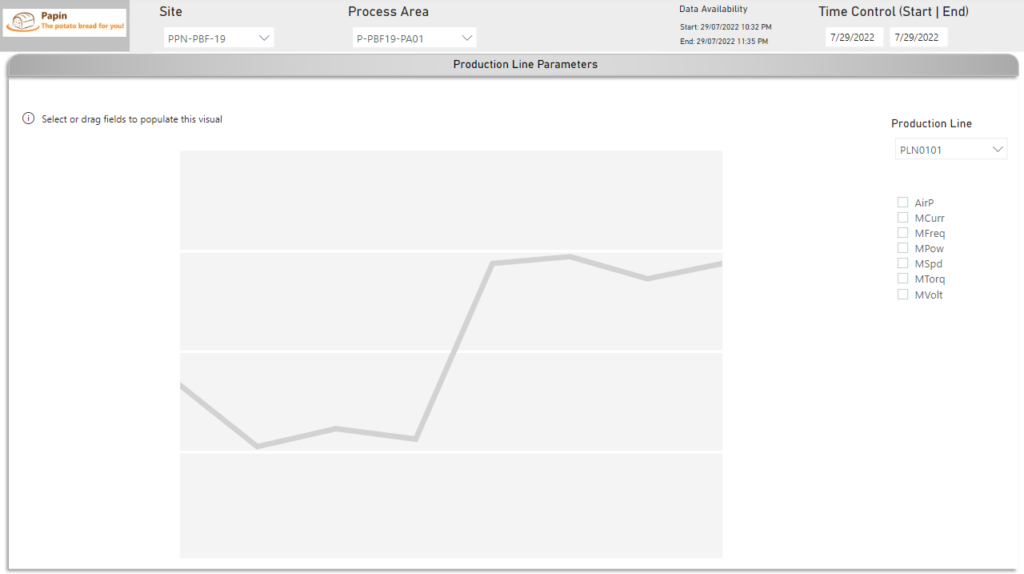
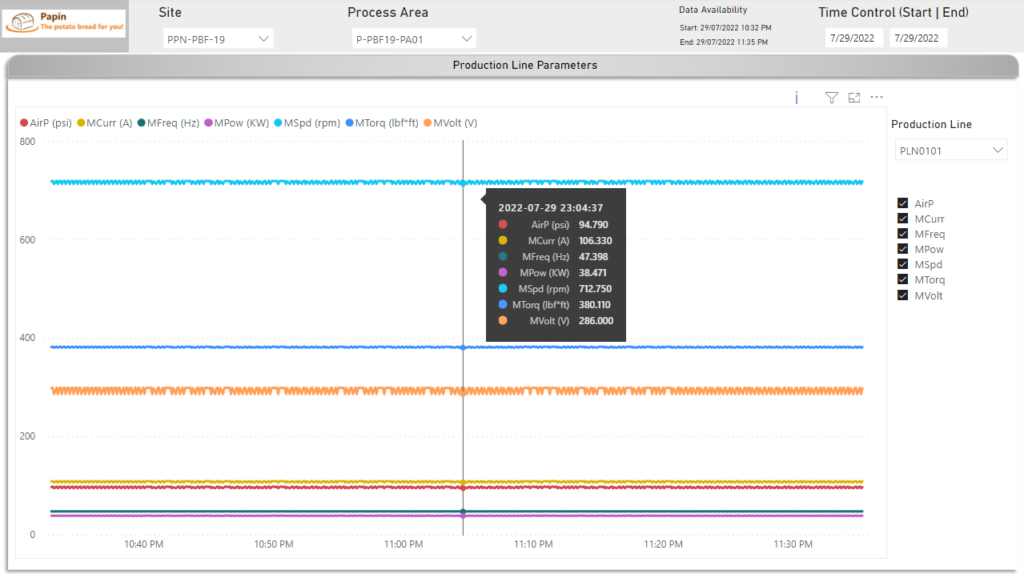
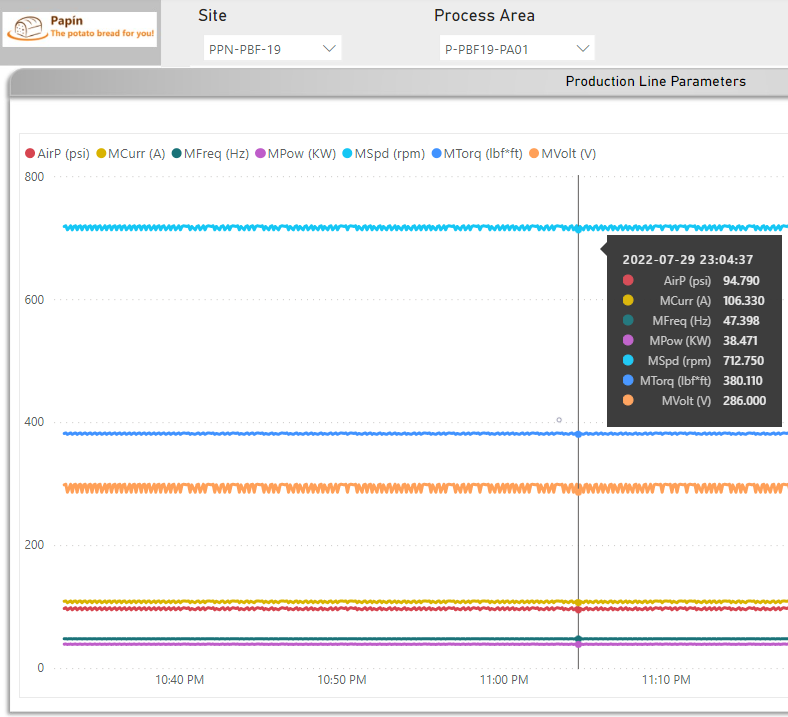
main()Power BI dashboard
In short, this is the dashboard that allow us to visualize all variables by time:
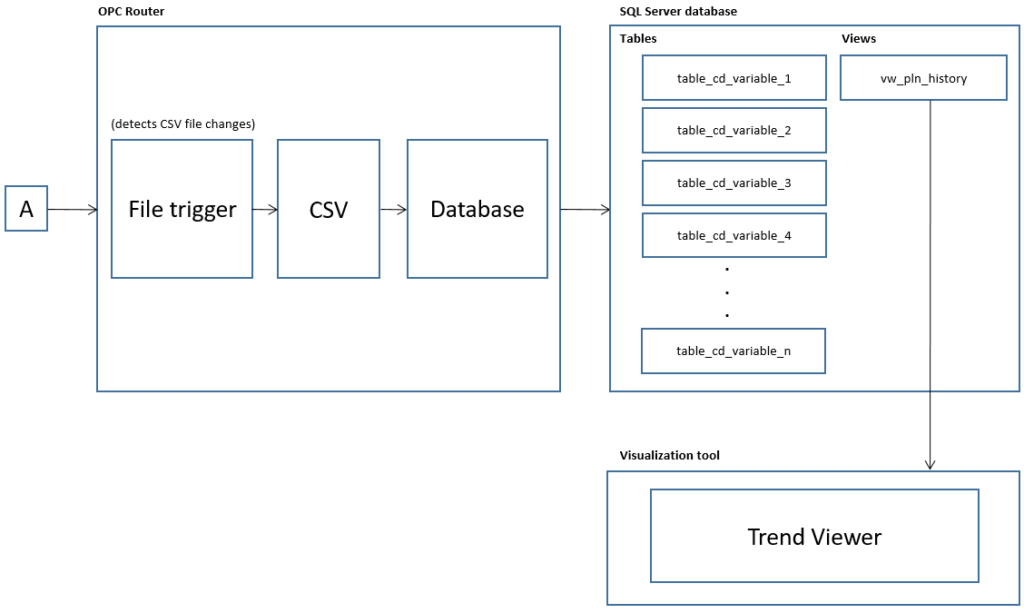
Working with OPC Router, CSV and SQL Server
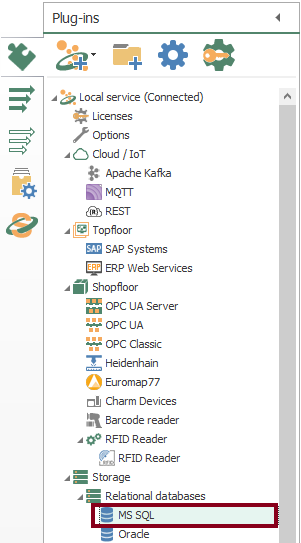
Knowing your Plugins
- To begin with, the configuration of OPC Router starts with your licensed plugins. There are several categories such as “Cloud / IoT”, “Topfloor”, “Shopfloor”, “Storage”, “Advanced”, “Messaging” and “Printer”.
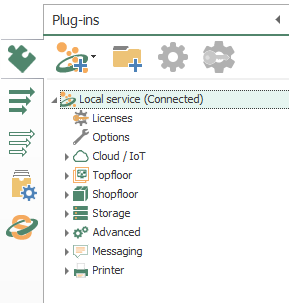
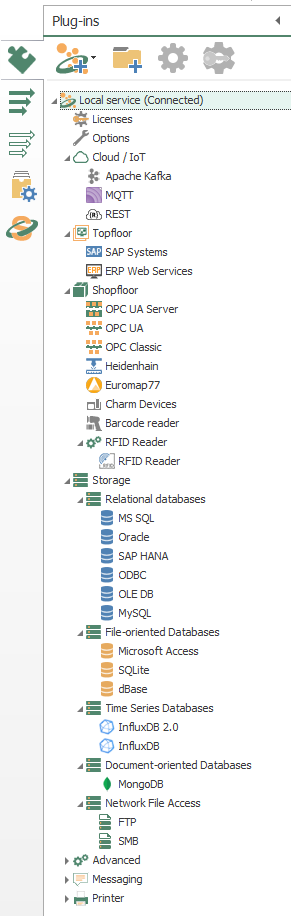
- Make sure to notice MS SQL.
Knowing your Transfer Objects
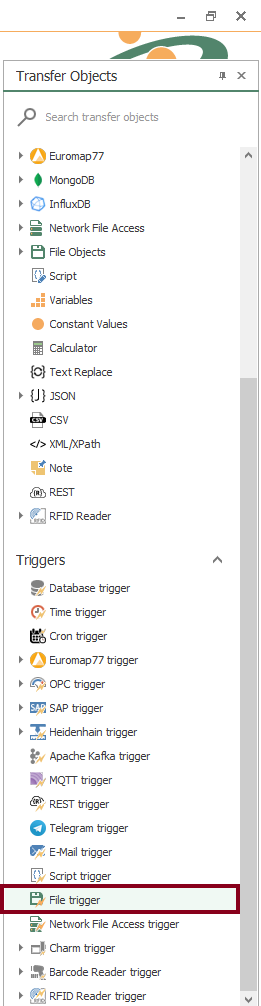
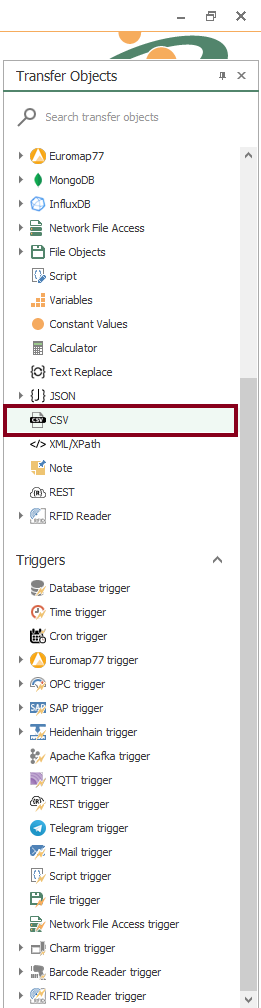
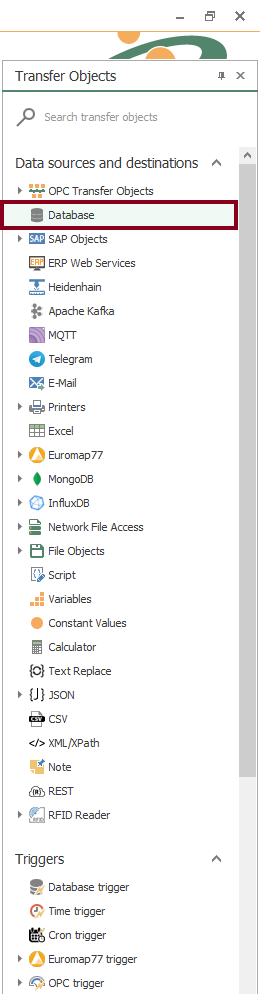
- At this point, we’re going to need three (3) transfer objects to solve our use case:
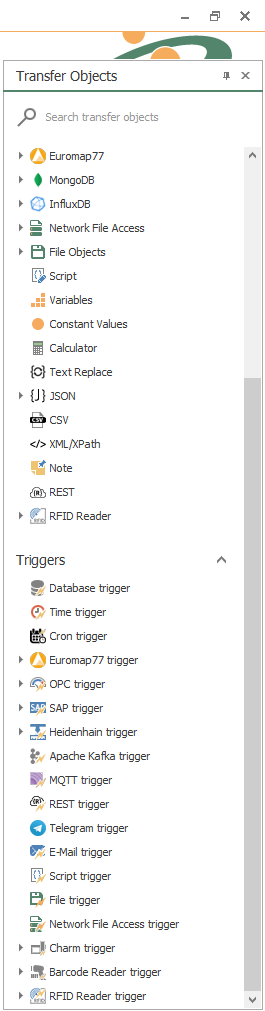
- Make sure to notice File trigger, CSV and Database.
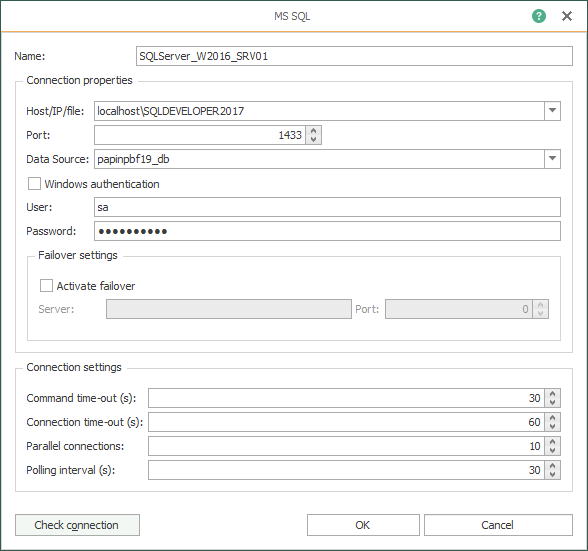
Checking your Plugins
- Following identification, OPC Router needs to configure every licensed plugin. Let’s check the plug in instance with MS SQL (double click on object):
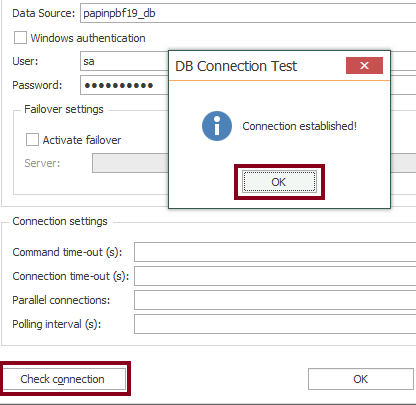
- Then, check the local Microsoft SQL Server database storage and press the “Check connection” button to test connectivity.
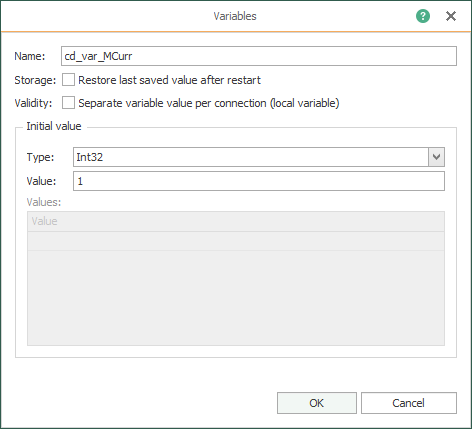
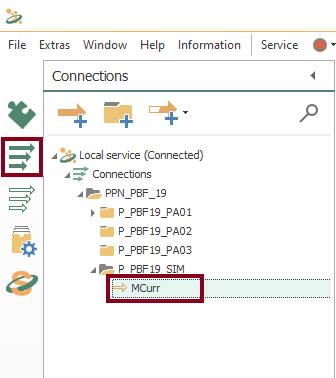
Defining and Checking your Variables in OPC Router
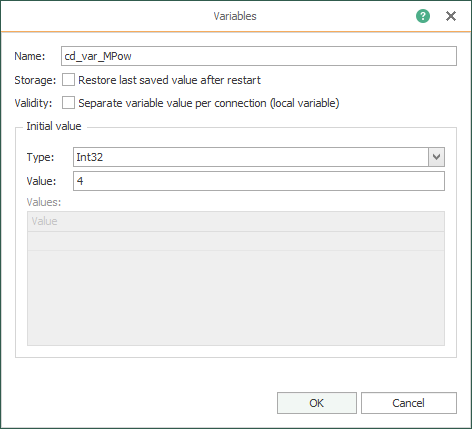
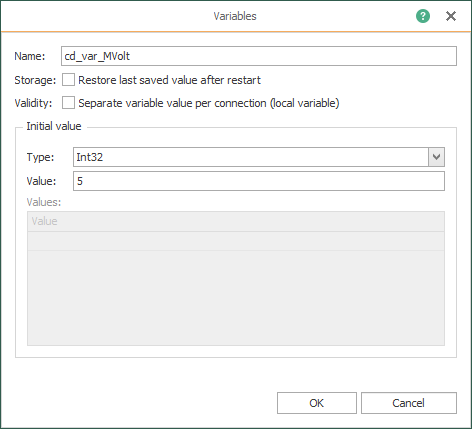
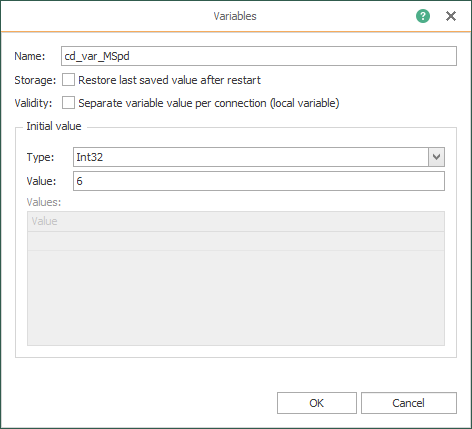
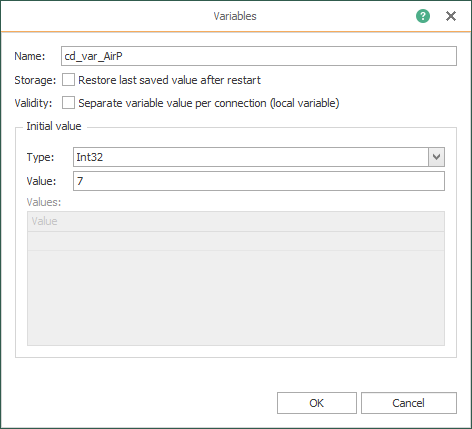
- Create the code (or check it, if it was done already) that identifies the seven (7) variables to simulate:


Creating your Fifth Template
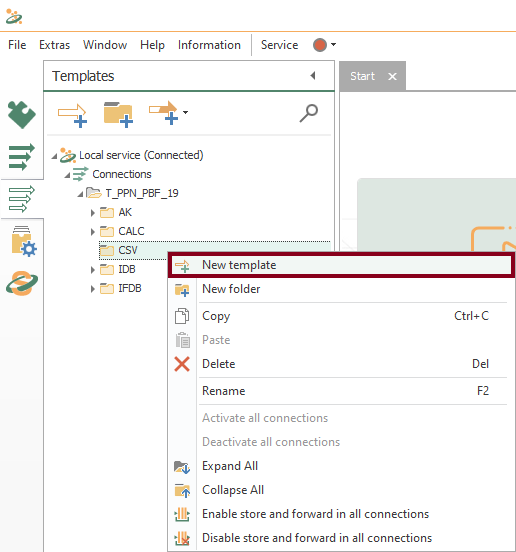
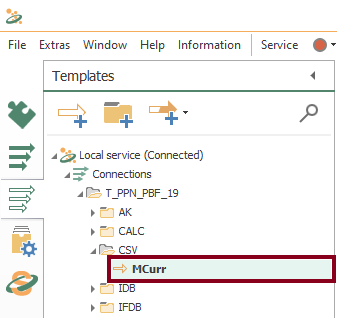
- In similar fashion to the fourth part of the tutorial, a template is the correct approach once again. Let’s create a new CSV template MCurr within CSV folder (VSD motor current):
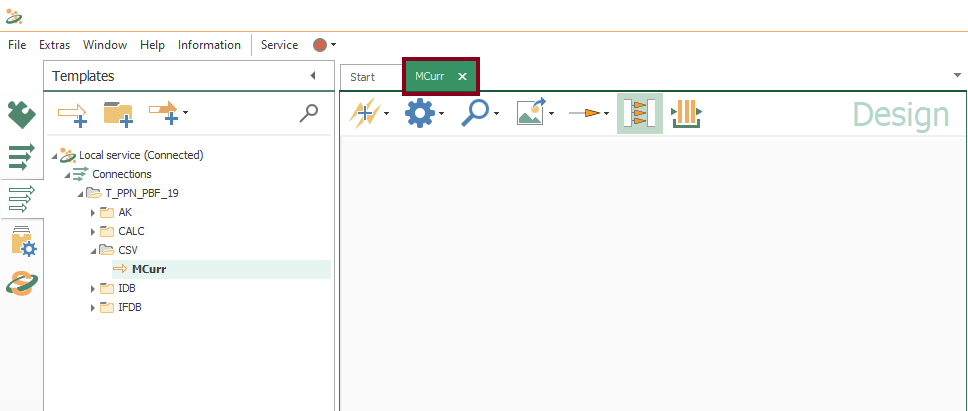
- Watch an empty design panel so you can start building your template:
- Insert the File trigger block:
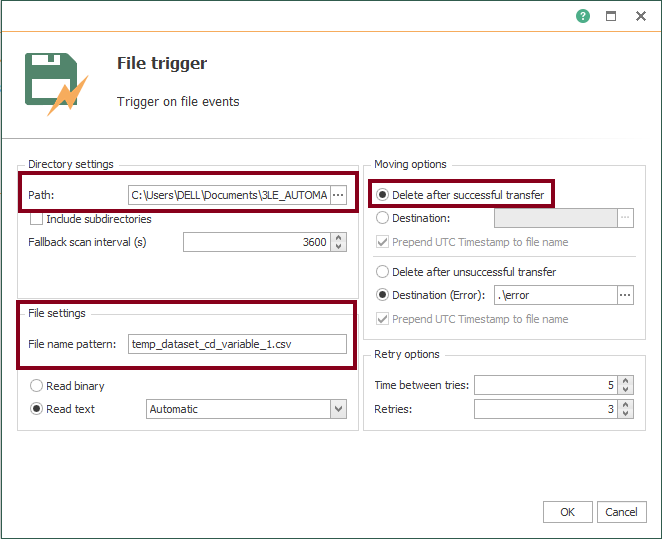
- Edit the File trigger block and make sure it looks like this:
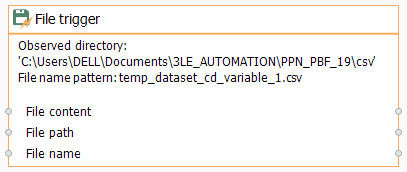
- Confirm the configured File trigger block:
- Insert the CSV object:
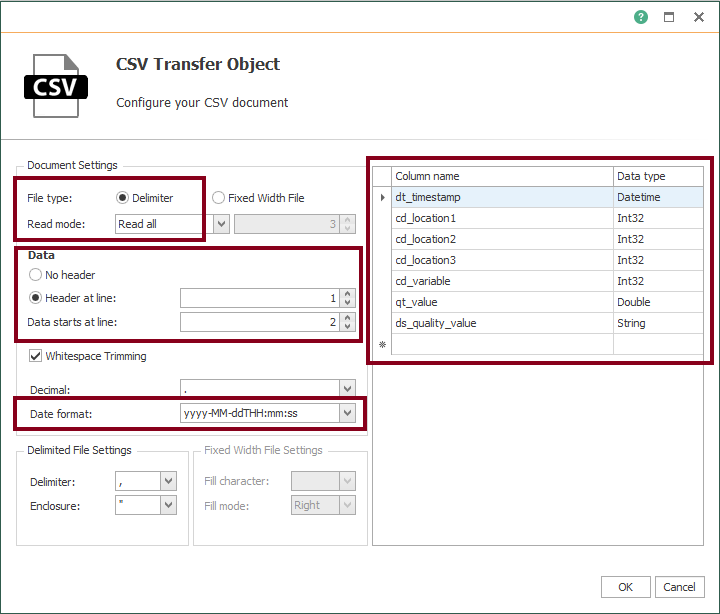
- Edit the CSV block and make sure it looks like this:
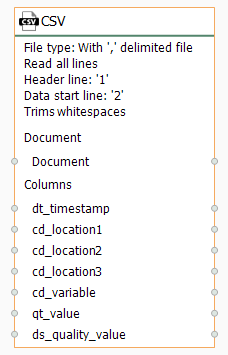
- Confirm the configured CSV block:
- Insert the Database object:
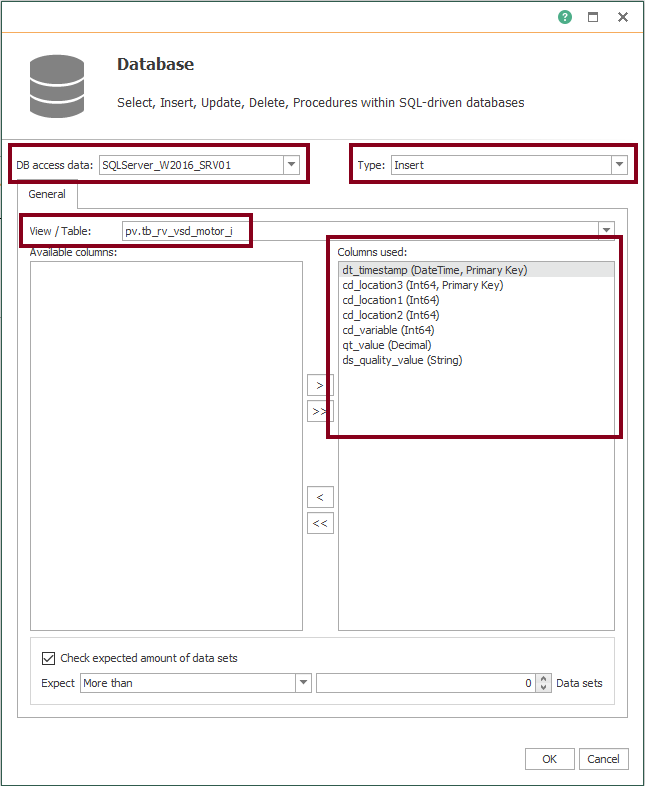
- Edit the Database block and make sure it looks like this:
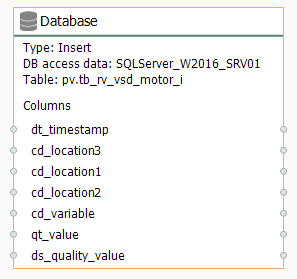
- Confirm the configured Database block:
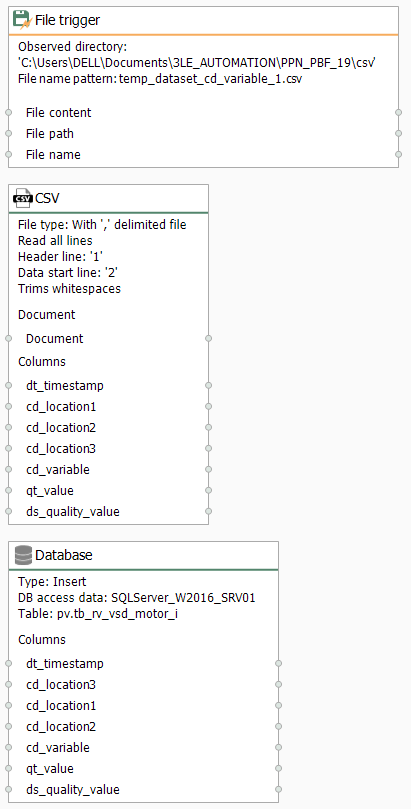
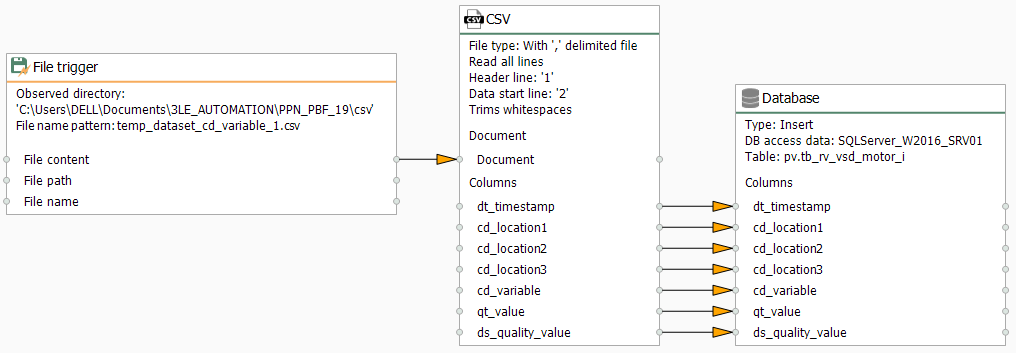
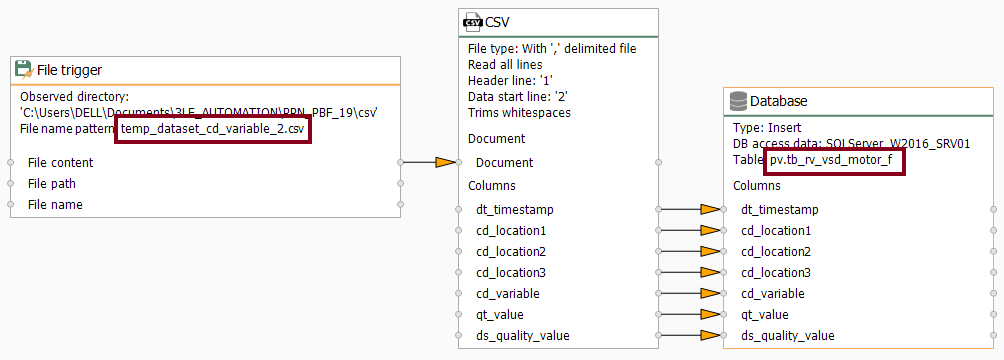
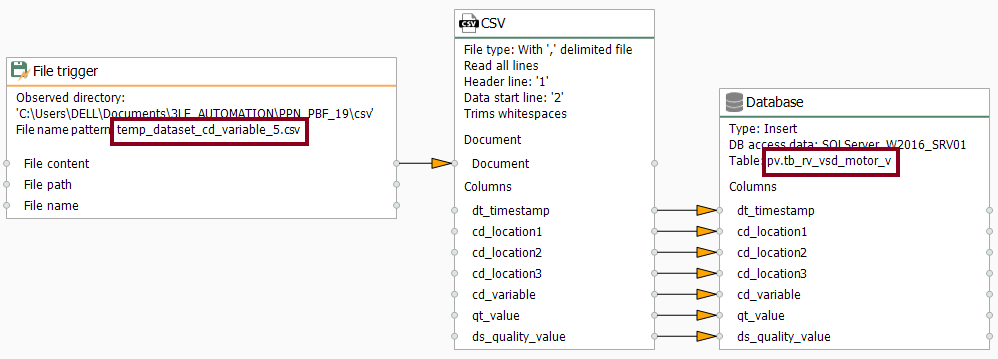
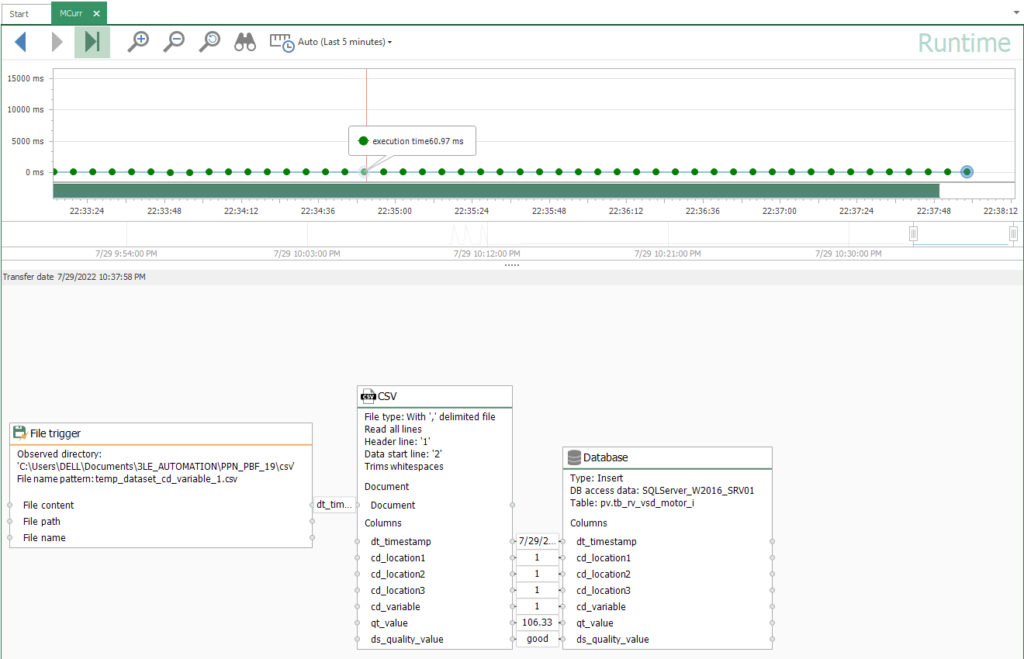
- Make sure all transfer objects look like these:
- At last, make sure to link blocks as shown here to complete your fifth template:
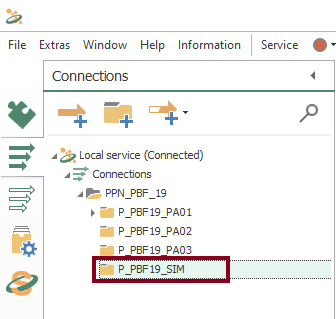
- Additionally, create the connections folder “P_PBF19_SIM”:
Working with Instances from Templates
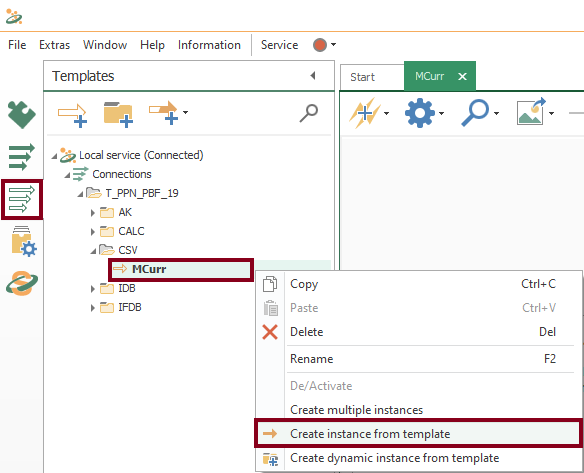
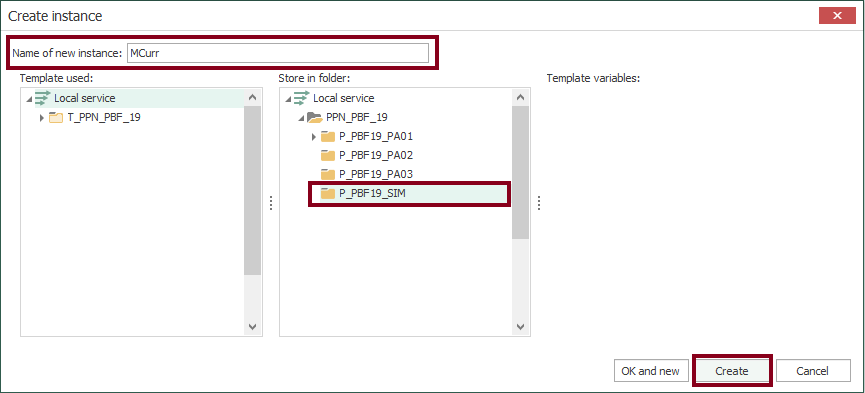
- With your fifth template, a new instance is required now. Start creating it using the contextual menu:
- At this time, check the new instance:
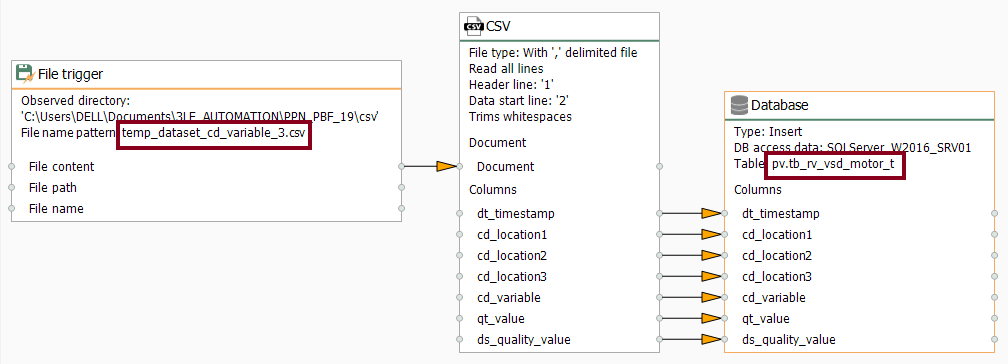
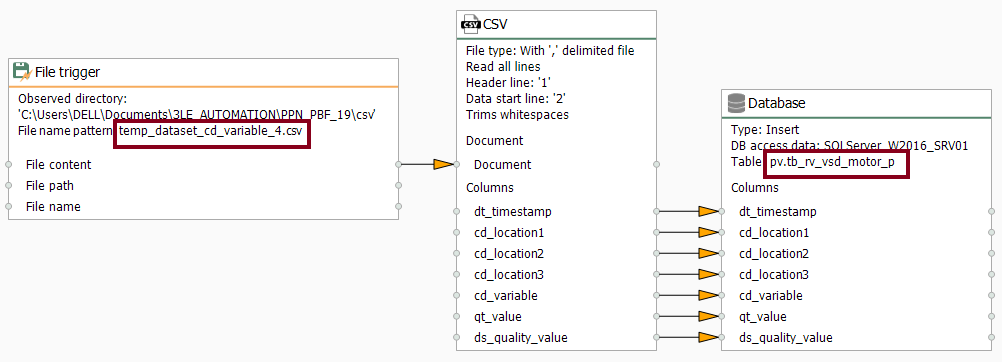
Create Remaining Templates
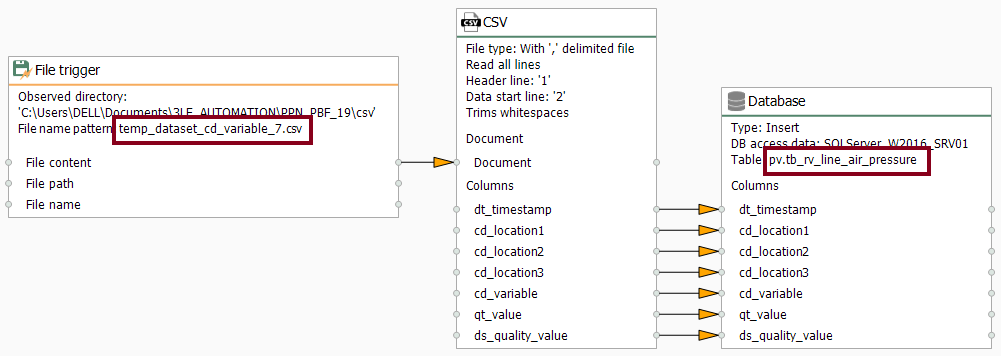
- Copy and paste the recently created template to start creating them for the rest of the variables (MFreq, MTorq, MPow, MVolt, MSpd and AirP):

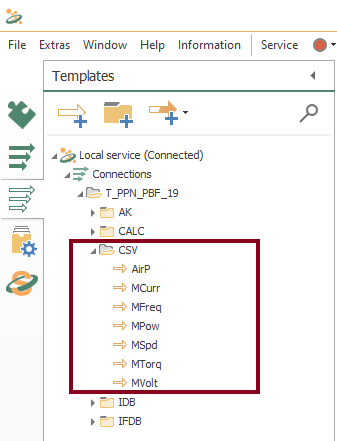
- Without delay, make sure the CSV templates folder look like this:
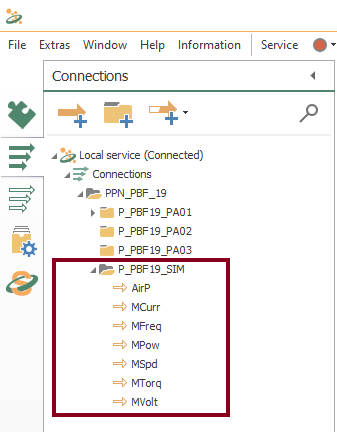
- For each template, create their respective connection:
Compile, Save and Publish your OPC Router Project Configuration with CSV and a Simulator
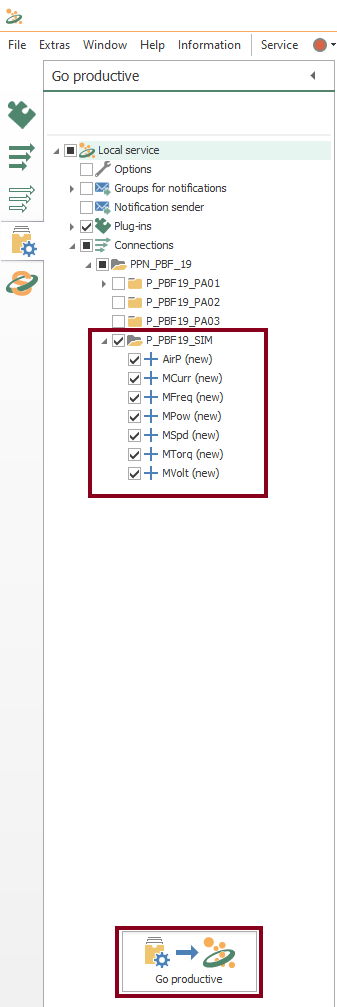
- At this time, you need to compile, save and publish the connections you just created by clicking the “Go productive” button:
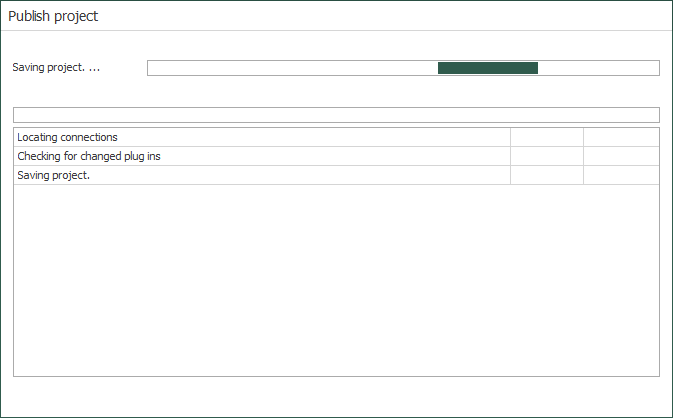
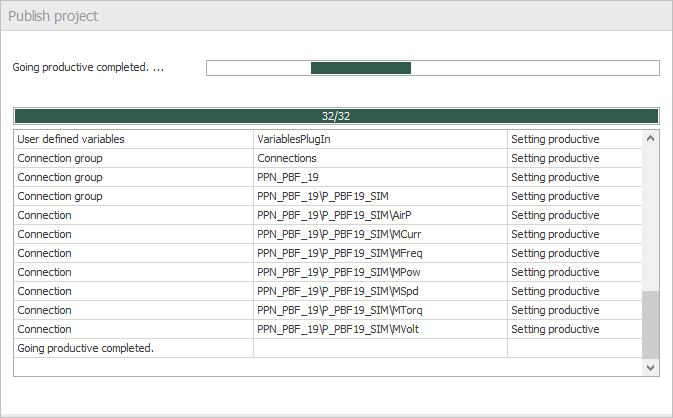
- Meanwhile, the project is saved and published.
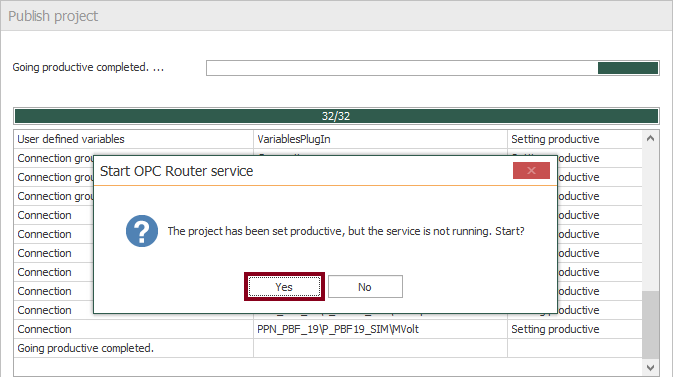
- Press the “Yes” button to start the OPC Router service and run your application.
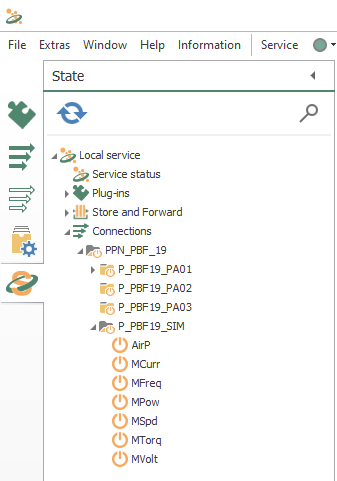
- Watch how the state of every connection changes until they are fully operational:
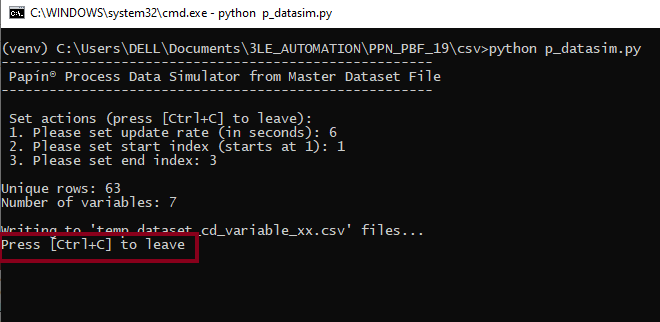
Run the Python application
- Open a terminal prompt, activate your virtual environment (if you’re using one) and run the following command:
python p_datasim.py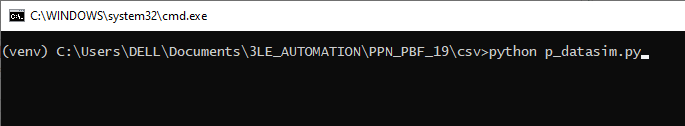
- At this instant, set update rate (as 6 seconds), start index (as 1) and end index (as 3):
- Only if you want to terminate the simulation, press [Ctrl + C].
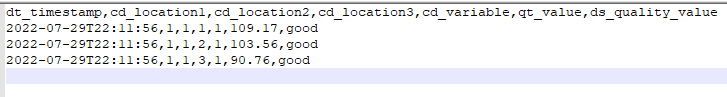
Inspect CSV Data Structure
This is the data structure of the “temp_dataset_cd_variable_xx” CSV files that the Python application generates:
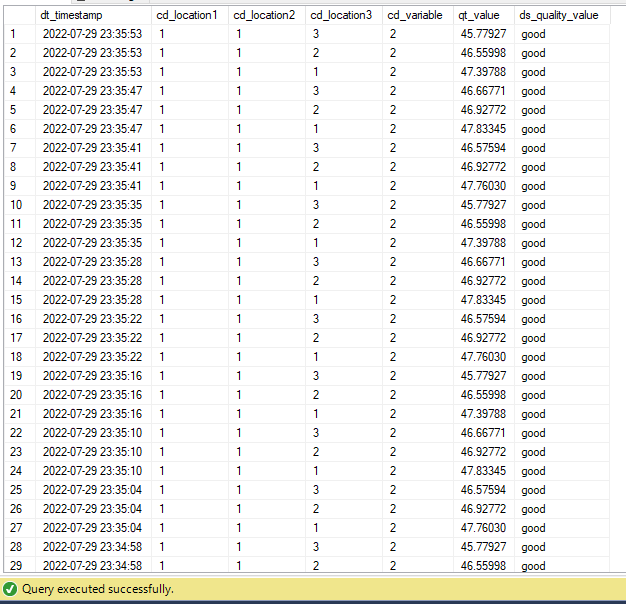
Verify OPC Router Data Transfer from CSV to SQL Server
- Additionally, you can verify data transfer within the SQL Server by running SSMS on MFreq or the SQL view:
Visualize Simulated Data in Power BI
- Refresh the dashboard in order to get the most recent simulated data:
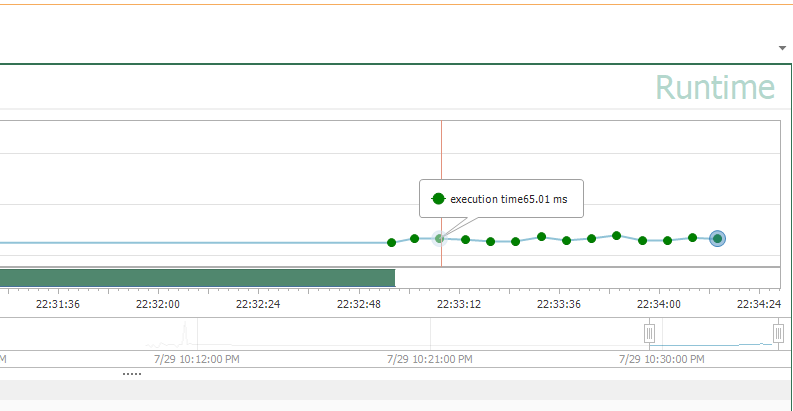
Check State and Visualize Online Data in OPC Router
- At this point, you should notice an execution time visually (it’s 65.01 milliseconds in this example):
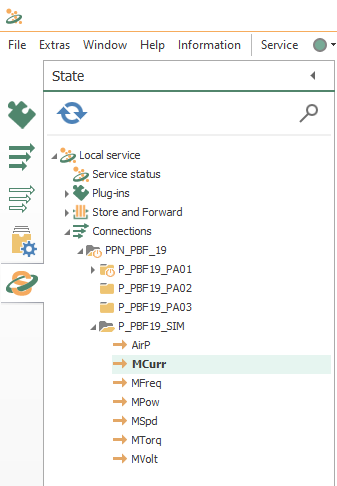
- Finally, check all running connections here:
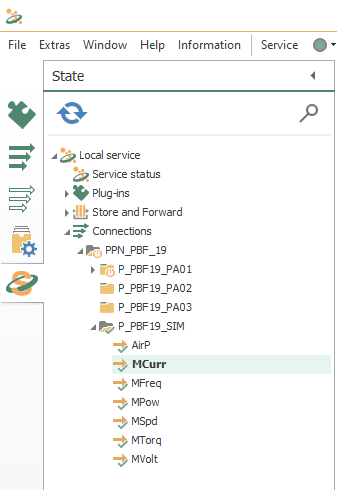
- Also, you can watch live values here:
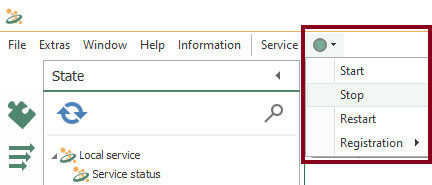
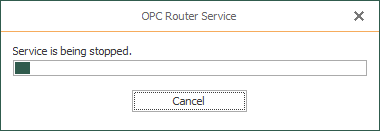
Control OPC Router service
- You are able to start, stop or restart the OPC Router service when needed.
Did you enjoy this OPC Router tutorial with a Simulator? I’d love to hear from you.
Stay tuned and follow part 7 of this tutorial! 😎
For other articles like this one in English, click here. To see them in Spanish, click here.